
Case study
Verikai: leading product design, brand, and marketing
Verikai is an AI-driven InsurTech company. Its platform gives insurance underwriters machine-learning risk scores for group health. I joined as Principal Product Designer, led product and brand design as Director of Design, then took over marketing as Senior Director of Design & Marketing.
- Roles
- Principal Product Designer, 2021. Director of Design, 2022–2023. Senior Director of Design & Marketing, 2023–2025.
- Scope
- Product design, design system, brand, website, content, marketing
- Marketing results
- +500% demo requests and +353% marketing engagement in one quarter
- Company
- Acquired by American Financial Group for ~$120M, effective December 2021
01
One role across product, brand, and marketing
Verikai's customers are insurance underwriters. They use the platform to act on machine-learning risk scores, and the company's website described the product as comprehensive group health risk analysis.
I joined Verikai as Principal Product Designer in 2021 and was already doing the product design and branding. American Financial Group acquired the company that December, and Verikai kept operating as a standalone business. After the acquisition the Director of Design title formalized that role within the parent company's title structure: I set brand and product design strategy, ran design reviews, and guided engineers through the design work. From 2023 to 2025, as Senior Director of Design & Marketing, the role added marketing: I directed the brand overhaul, ran the marketing program, and built the Figma design system used across product and marketing.
The growth numbers on this page came from the marketing program. The product redesign has its own, smaller set of results.
Marketing raised demo requests 500% and marketing engagement 353% within one quarter, and LinkedIn engagement grew more than tenfold. On the product side, the redesigned CSV import cut import errors 90% and brought customer setup under 10 minutes.
02
What I inherited, and how the job grew
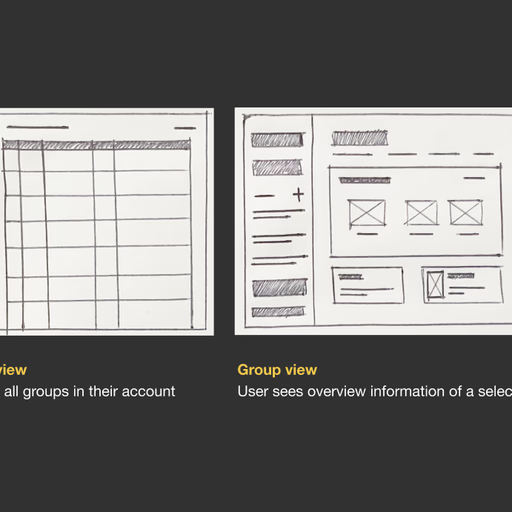
The platform
Underwriters had to act on risk scores they couldn't interrogate. The interface had grown around the model: inconsistent patterns, fragmented workflows, and predictions shown without the evidence and context a person needs to judge them.
Data import
Underwriters imported large CSV files, and the process was error-prone. Column headers rarely matched Verikai's fields, users abandoned uploads partway through, and support tickets piled up.
The brand
Verikai read as informal and lacking gravitas in the insurance industry. That undermined its credibility with the enterprise clients it was trying to win.
- 2021 · Principal Product Designer
- My first role at Verikai. I was already doing the product design and branding. American Financial Group acquired Verikai that December.
- 2022–2023 · Director of Design
- The title caught up with the work. It formalized the product and brand design role I already had, and placed it in the parent company's title structure. I set the design strategy for both, ran design reviews, kept stakeholders informed, and worked directly with the CEO.
- 2023–2025 · Senior Director of Design & Marketing
- Marketing joined design under one role. The task was to reposition Verikai as a serious, trustworthy partner for risk assessment and underwriting decisions, and to make the website, collateral, and content say so consistently.
03
Product design: making the model's output legible
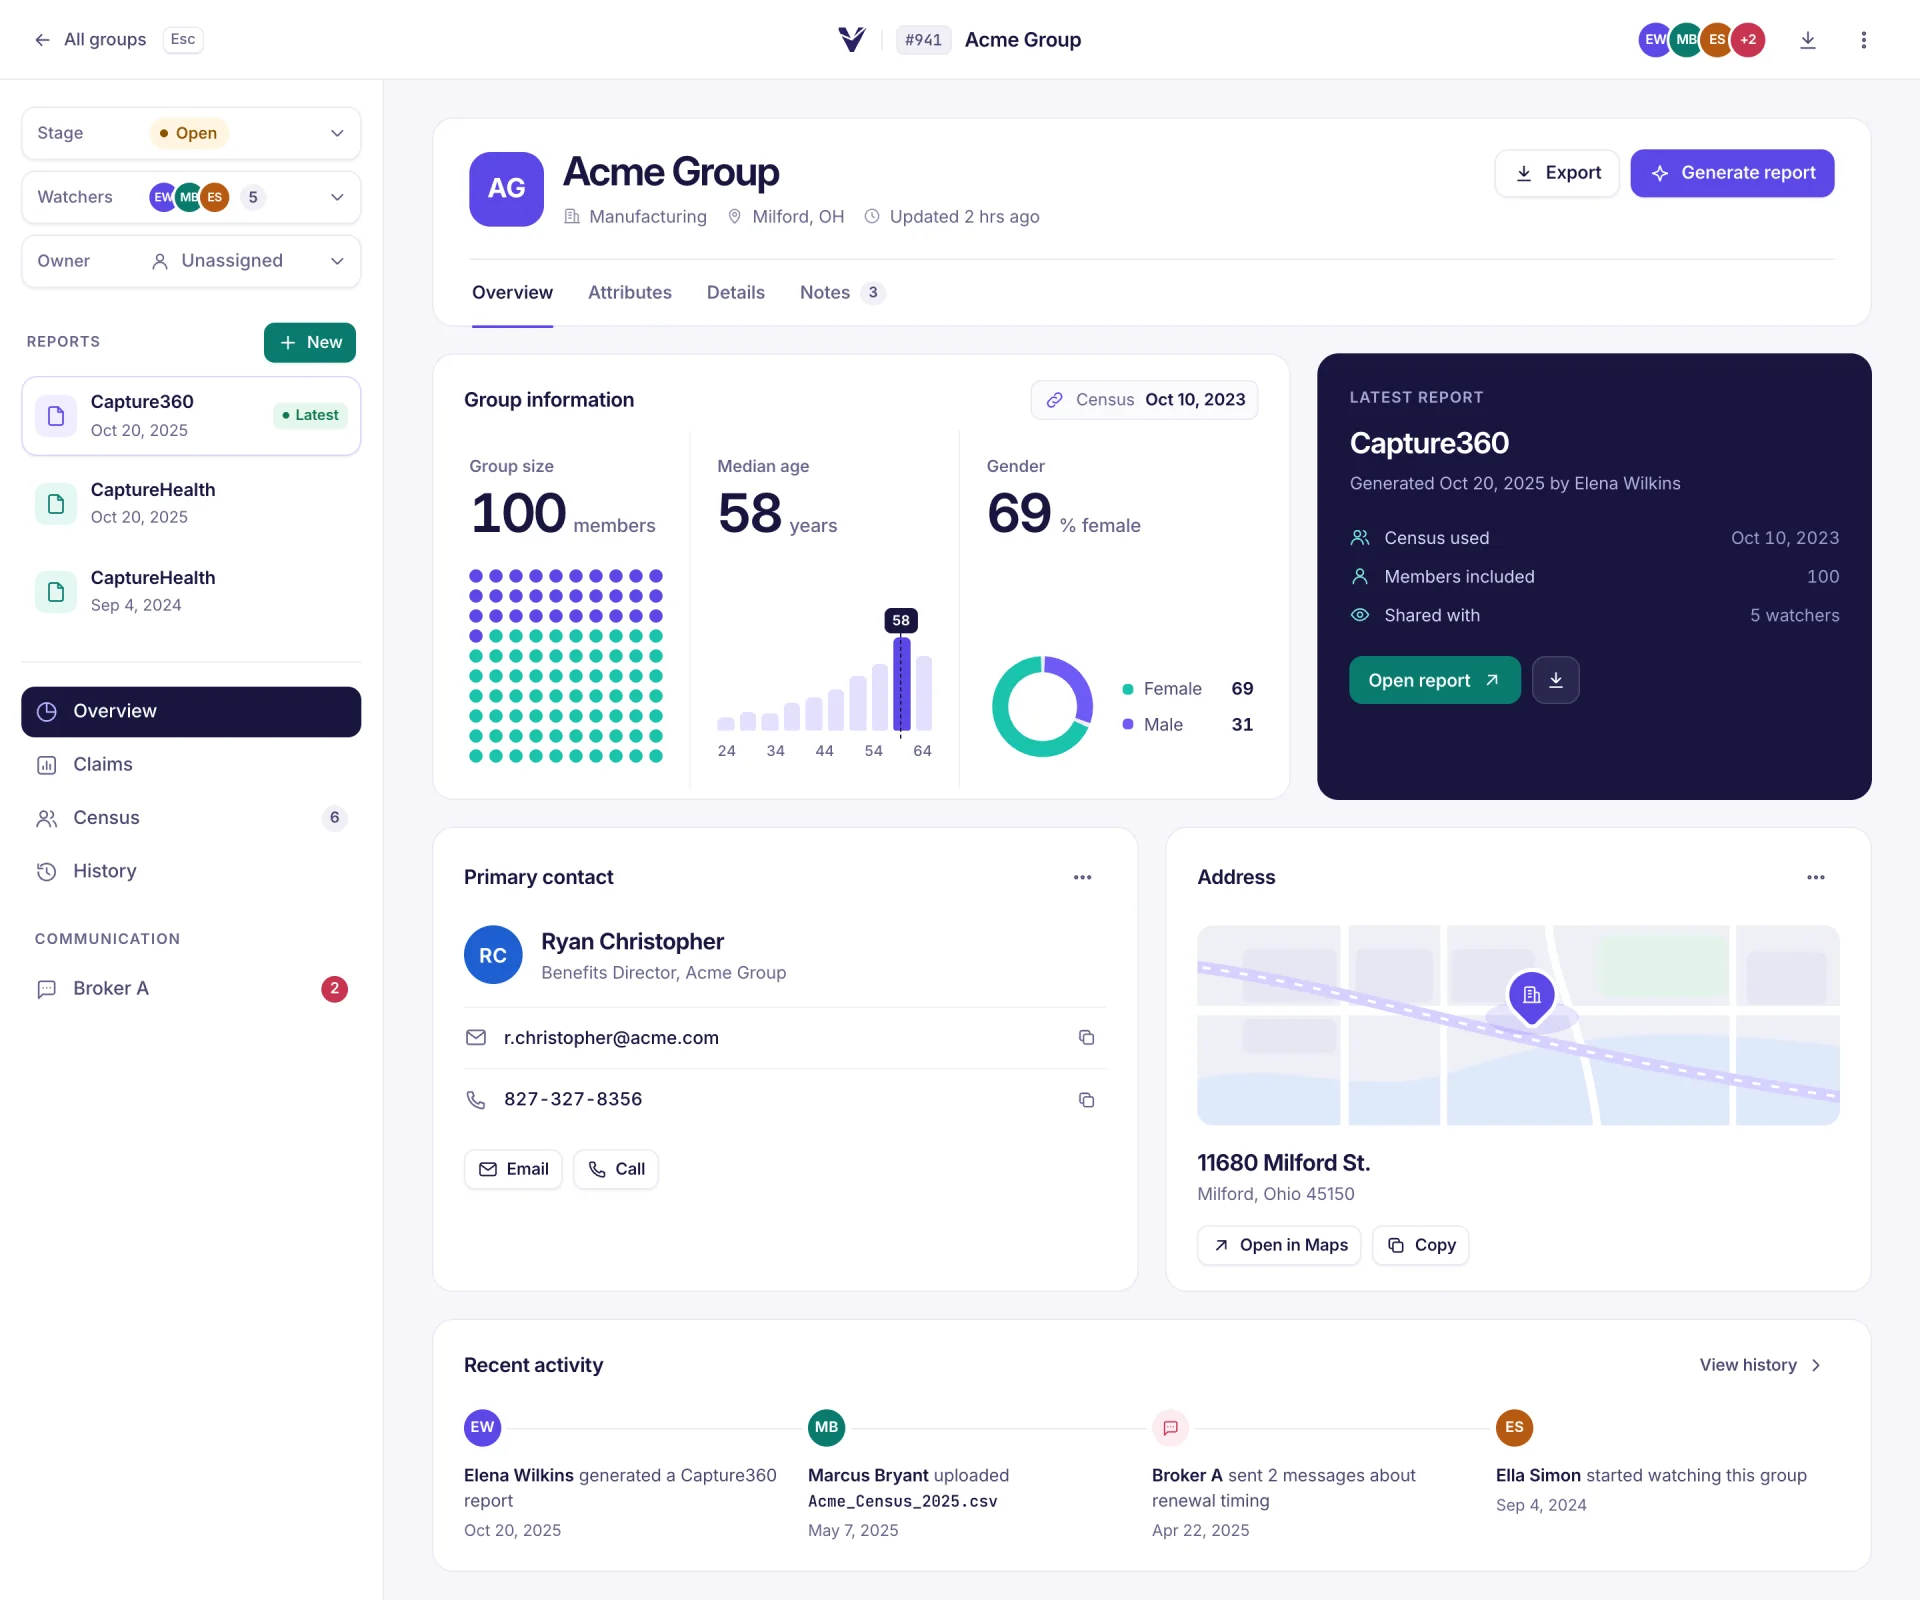
The redesign started from user research with underwriters and a map of their workflows. From there I established a unified design system and data visualization patterns that showed what a risk score drew on, where confidence was strong or weak, and what to check before acting on it.
I worked closely with engineering and data science so every pattern stayed faithful to what the model actually knew. The goal was output an underwriter could read, question, and defend to their own stakeholders.
Group information
Census Oct 10, 2023The CSV import
I designed a column mapping interface that matches CSV columns to Verikai's fields automatically where it can, and clearly surfaces the columns that need a person's decision. Inline data previews let users check a mapping before committing, and distinct states mark successful matches, ignored columns, and fields that need attention.
The import went from a support-heavy process to a self-serve tool. Errors fell 90%, setup time dropped under 10 minutes, and cleaner inputs meant the model's predictions started from defensible ground.
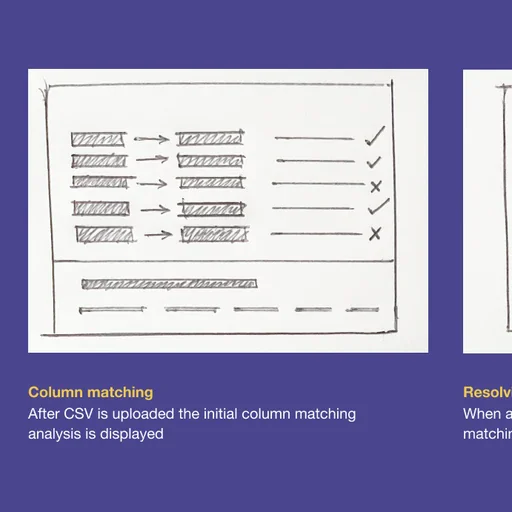
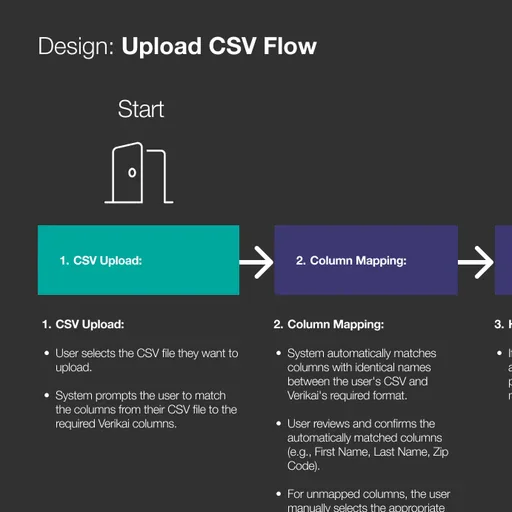
Match columns
Acme_Census_2026.csv · 431 rowsfirst_nameMarialast_nameAlvarezDOB_Text04/12/1966zip45150genderFnotes“prefers email”Add a census
Acme Group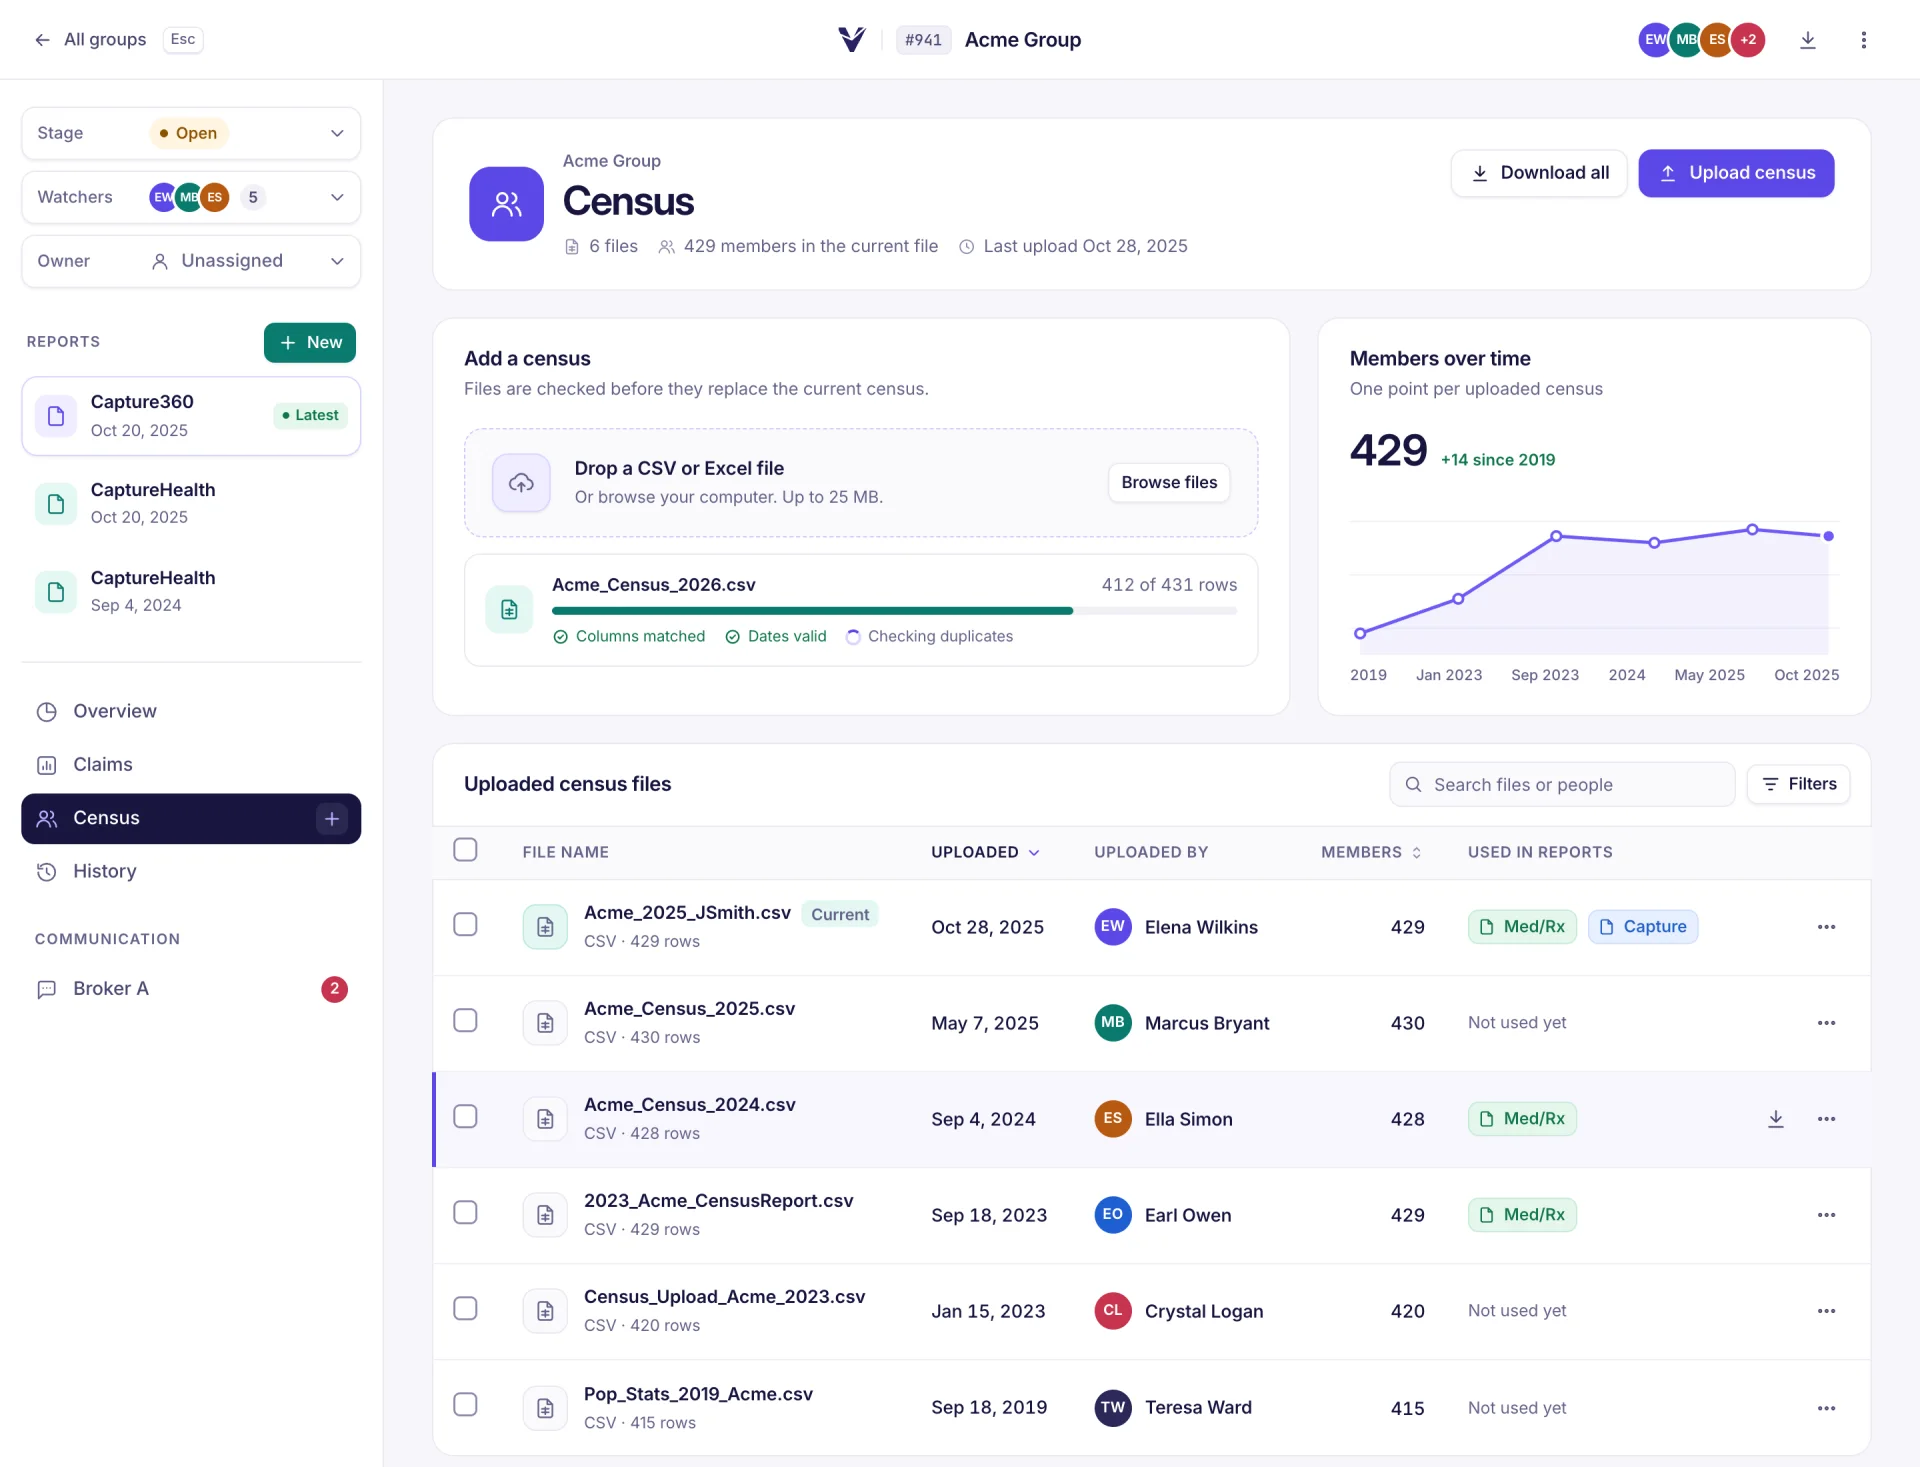
04
Taking over marketing
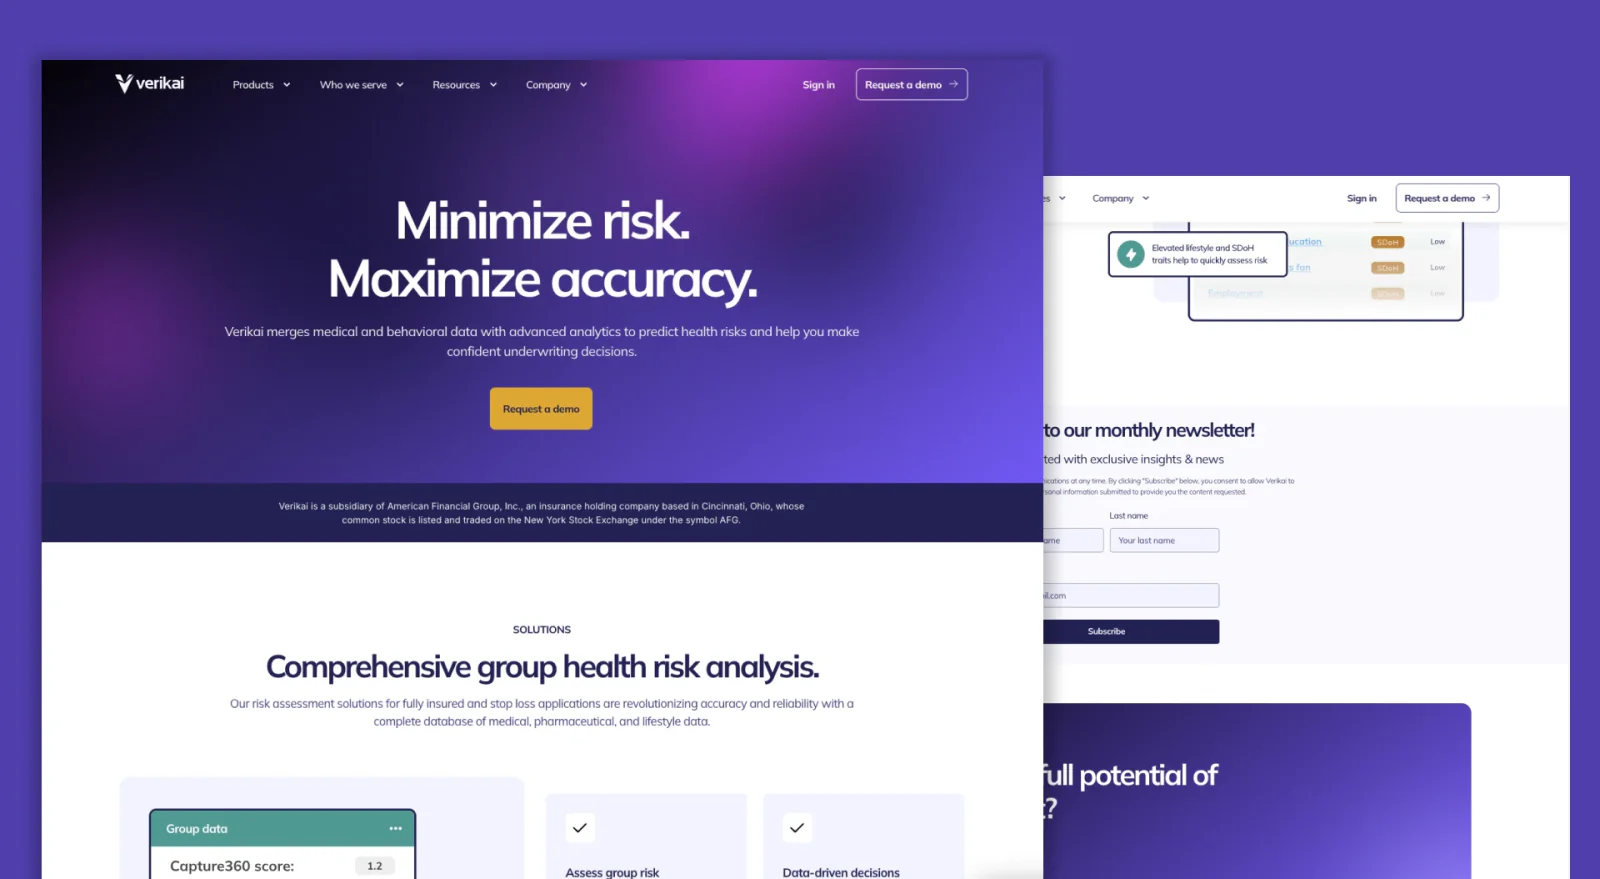
When marketing joined my role, the problem in front of it was credibility with enterprise insurance buyers. The work ran in phases: agree on who Verikai was, then rebuild everything that carried the message.
- Starting problem
A brand that undercut the sale
Verikai was perceived as informal and lacking gravitas, which undermined credibility with the enterprise clients it needed.
- Intervention
Reposition, with the executives on board
I assembled the key stakeholders and established brand guidelines, with executive buy-in secured at an off-site retreat. The position: a serious, trustworthy partner for risk assessment and underwriting decisions.
- Execution
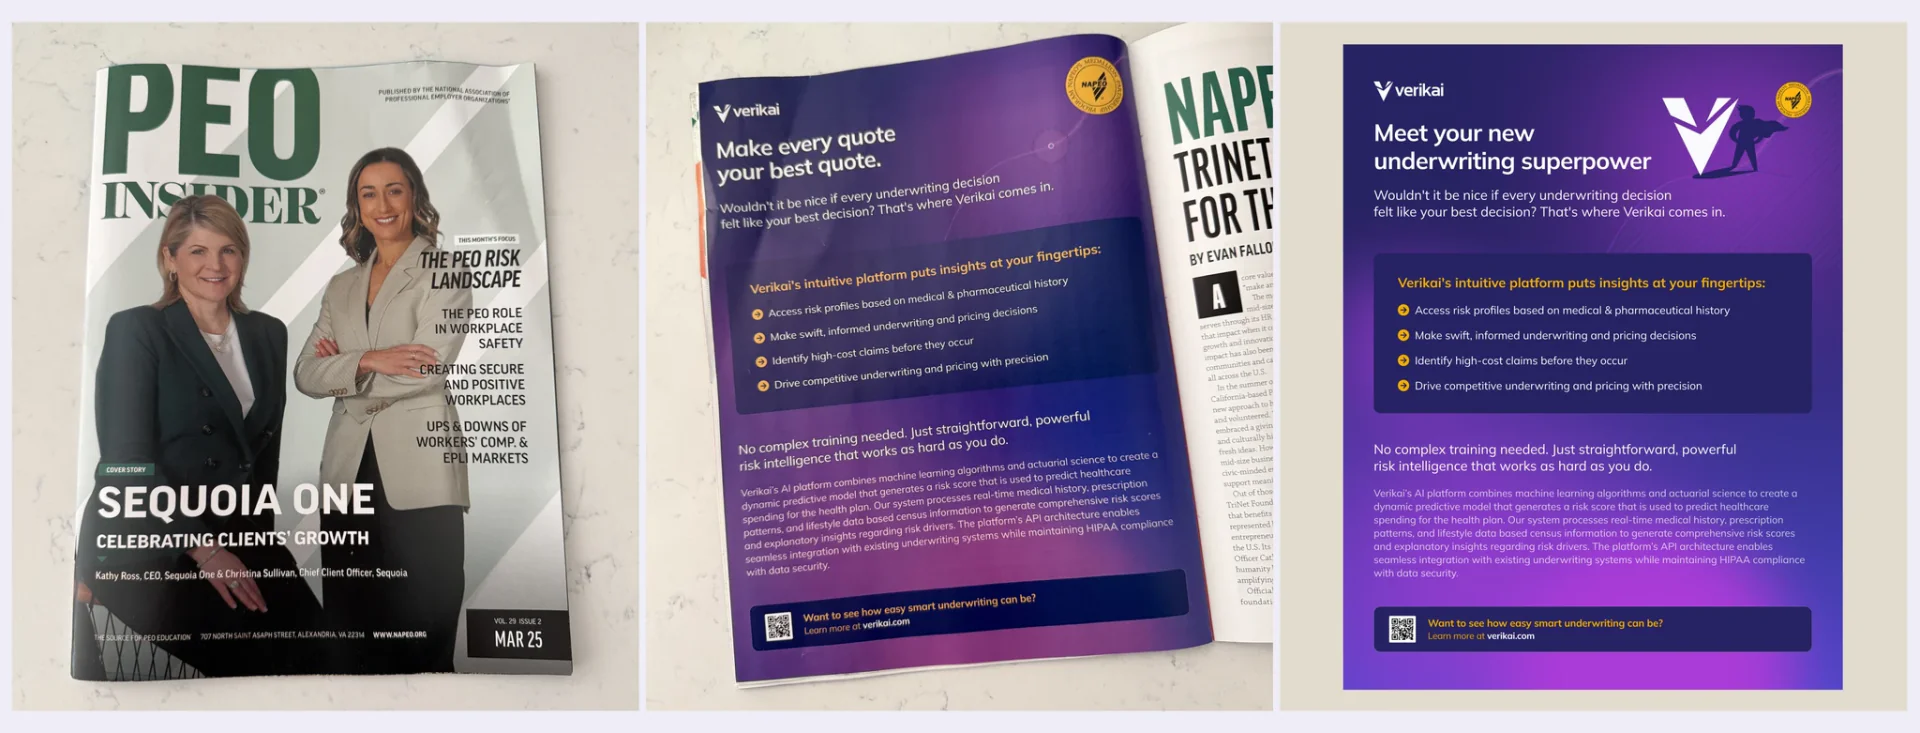
Rebuild every surface
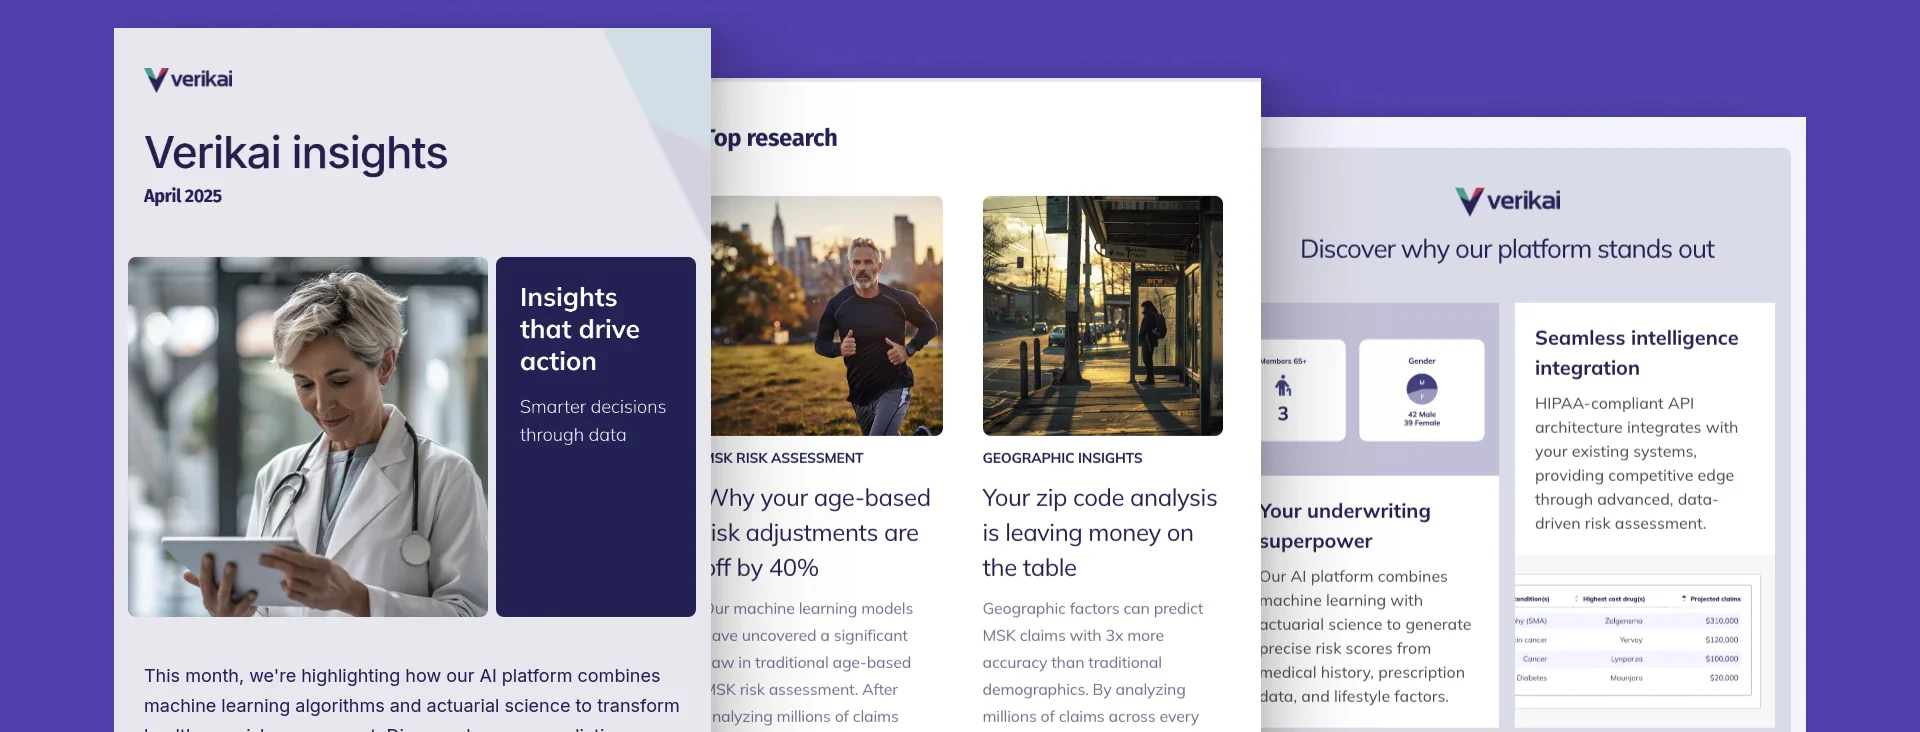
- A complete website redesign
- All marketing collateral updated
- A content roadmap: daily LinkedIn posts, monthly newsletters, and outreach to industry publications
- An AI-driven marketing program
- Measured result
+500%
demo requests within one quarter
+353%
marketing engagement in the same quarter
10×+
LinkedIn engagement
05
One story and one visual system
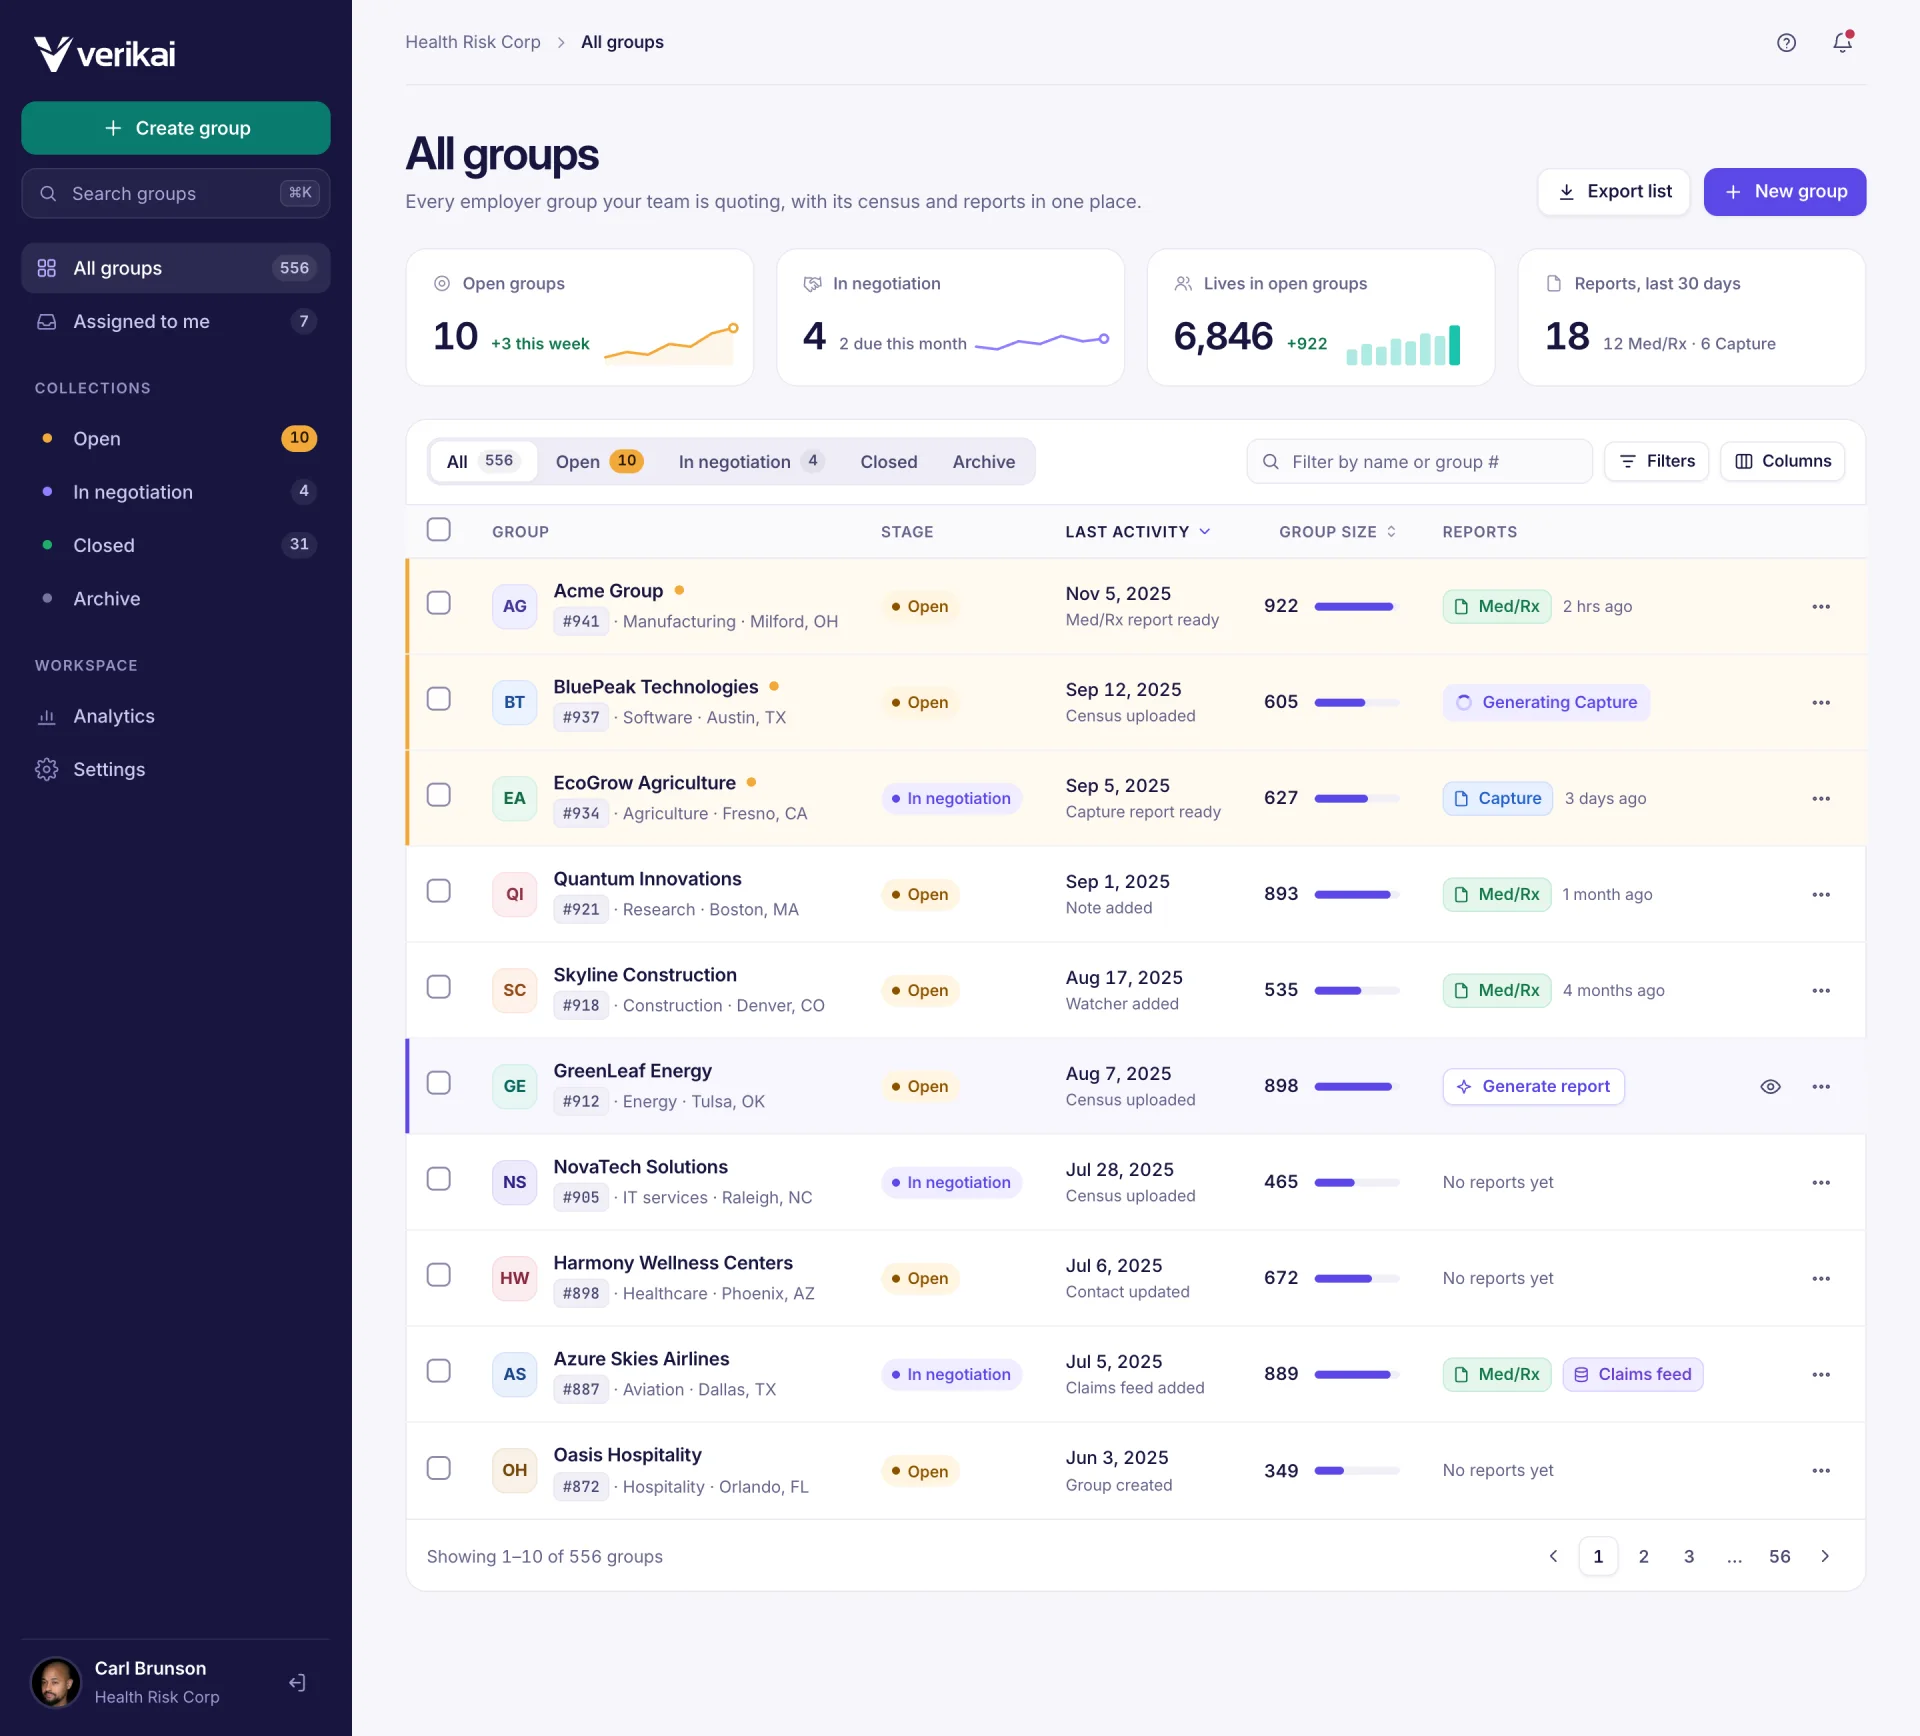
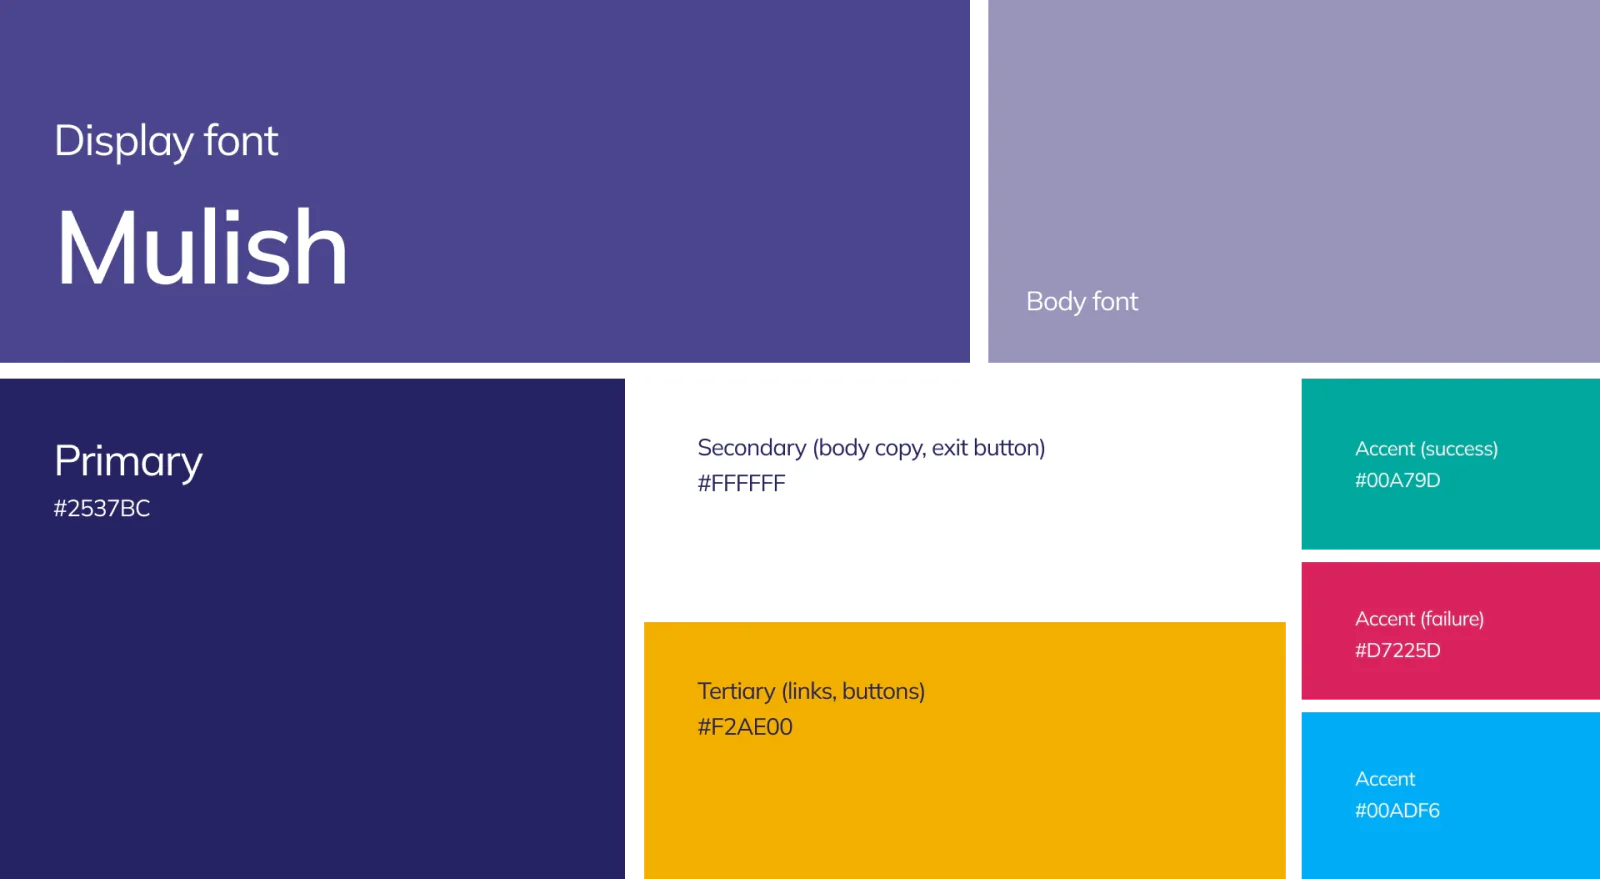
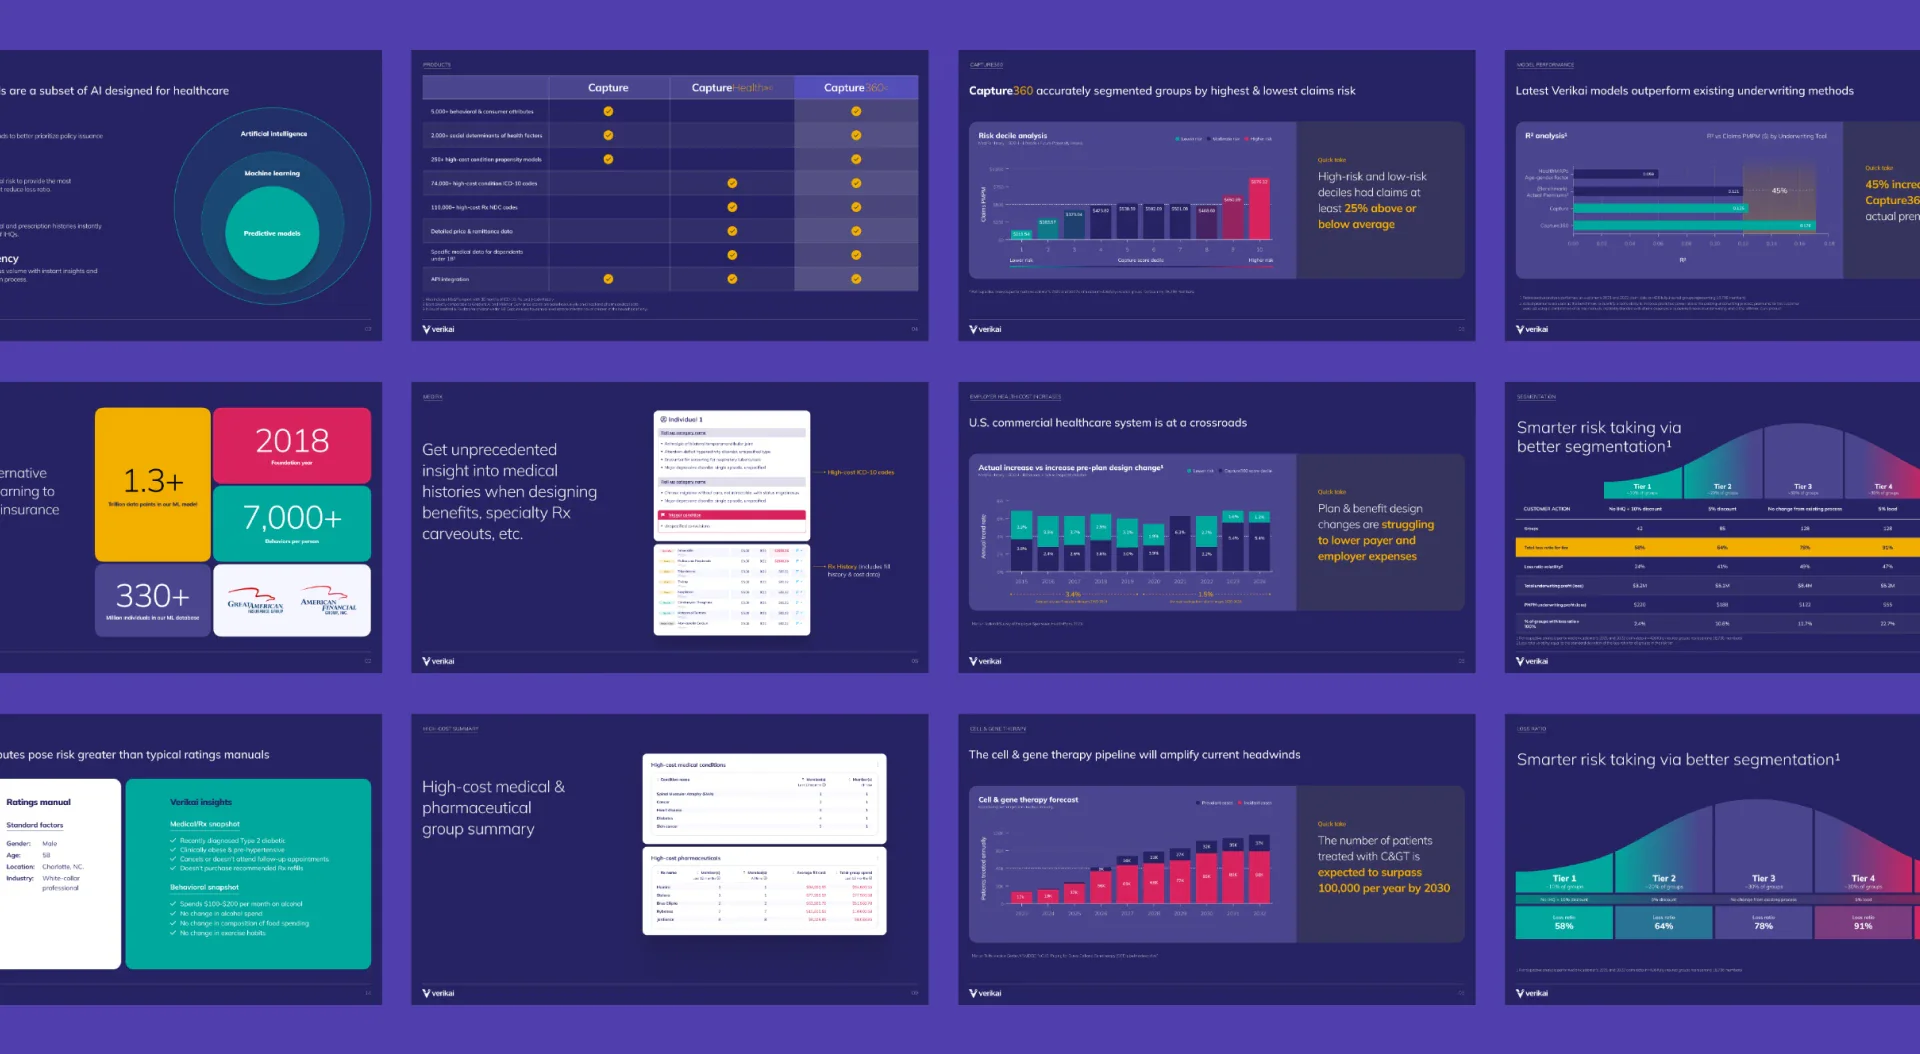
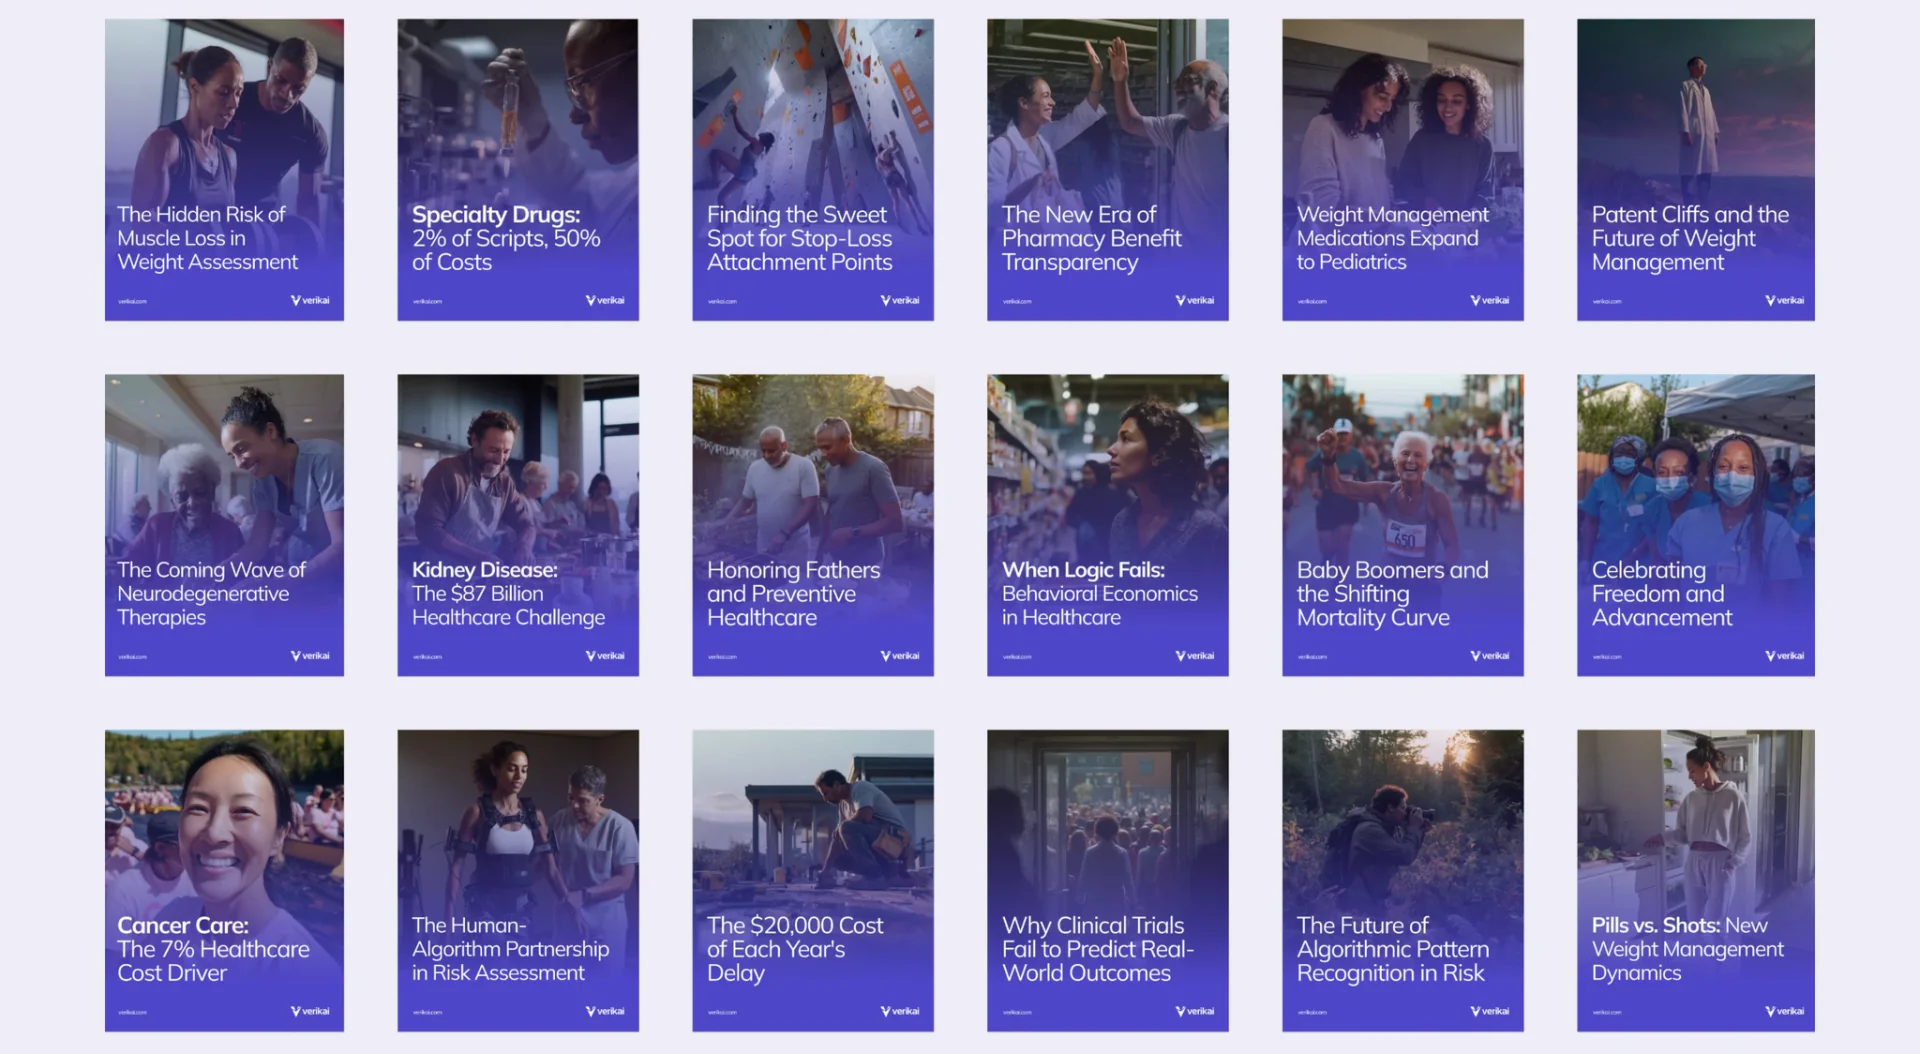
I built a single Figma design system and used it for both the product and marketing. The same deep indigo runs through the platform's navigation, the website, the newsletter, and the sales materials, so the product and every marketing surface read as one company.
06
What I owned, did, and led
Owned
Product design and branding from 2021, with the strategy formally mine as Director. Design and marketing together from 2023.
Did myself
Built the Figma design system used across product and marketing. Designed the CSV column mapping interface. Led the platform redesign from research through to the final screens.
Led and partnered
Ran design reviews and guided engineers through the design work. Kept stakeholders informed and worked directly with the CEO. Partnered with engineering and data science on the platform, and with company leadership on the repositioning. Directed the brand overhaul and the marketing program.
07
Results, and where each one came from
+500%
demo requests within one quarter
+353%
marketing engagement in the same quarter
10×+
LinkedIn engagement
−90%
CSV import errors after the mapping redesign
<10 min
customer setup time
~$120M
American Financial Group's acquisition of Verikai, effective December 2021, early in my time there. The leadership and marketing work on this page came after it.
Lessons
What leading across product and marketing taught me
- Make the model legible before making it pretty. The redesign showed what a score drew on and how confident it was, so underwriters could question a prediction and defend it.
- Fix the inputs, not just the outputs. The CSV import looked like a support problem. It was also a model problem: cleaner inputs meant predictions started from defensible ground.
- Credibility comes before content. Guidelines and executive agreement came first. The website, collateral, and content roadmap were built on them, and that's where the quarter's growth showed up.
Where this led
How should a system show its evidence so people calibrate their trust correctly?
Verikai was the clearest early version of that question. SlateRoom is where I'm working on it now.
Read the SlateRoom case studyContact